Profitability

How to Know Which Products or Services Are Actually Profitable

Centsible Trends8 min read
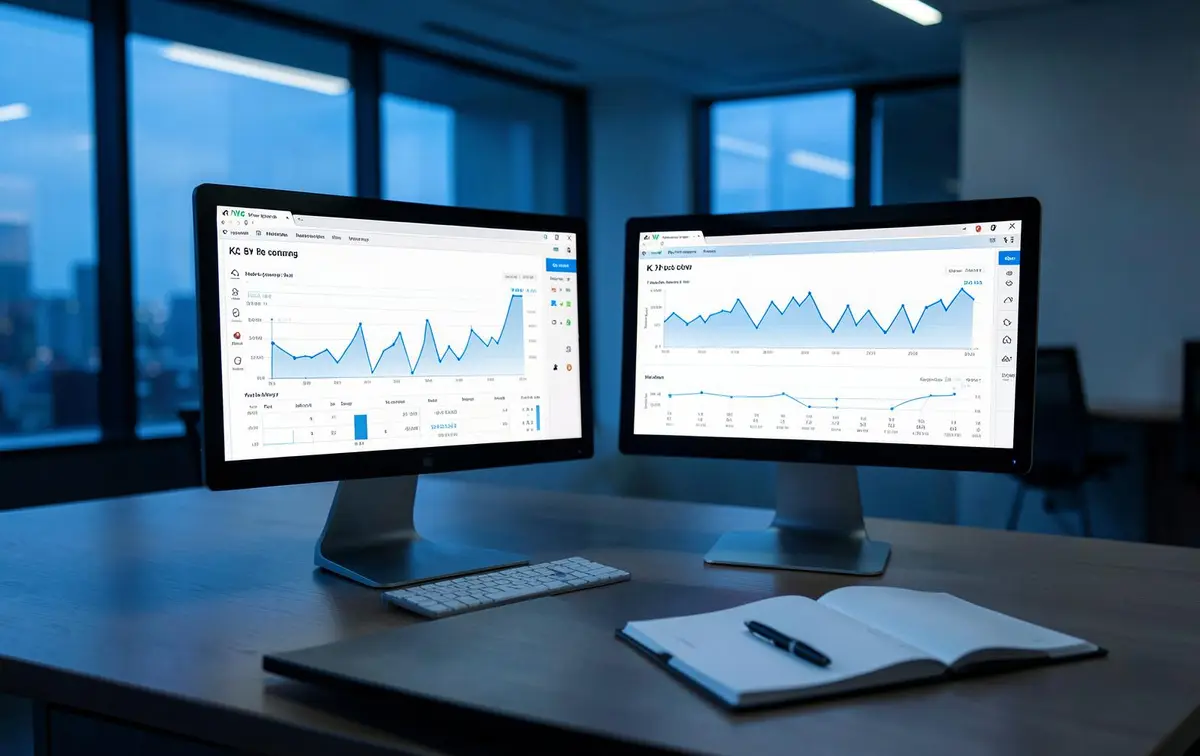
Financial analyst comparing margin reports against a chart on screen at a standing desk

You find out which products or services are actually profitable by looking below company-level gross margin, at the contribution margin of each line of business, product, service and customer segment once direct cost, labor and a fair share of overhead are allocated to it. Total revenue and a single blended margin cannot show you this — they average away the exact information you need.

Most owners already sense the answer intuitively: some work feels harder to deliver than it should be, some customers are more trouble than they are worth, and some products sell well without anyone being sure why they are worth selling. The purpose of a profitability analysis is to replace that intuition with numbers that hold up under scrutiny.

Key takeaways

  • A single company-wide margin figure is not enough to run a business; profitability has to be broken out by product, service line and customer.
  • Most of the work is in allocating labor, delivery cost and overhead honestly rather than in the math itself.
  • The output should change three things: pricing, resource allocation, and which customers or offerings the business keeps investing in.

Why company-level margin is not enough

Gross margin at the top of the income statement is an average across everything the business sells. Averages conceal variance. A company running a healthy 35% gross margin overall can simultaneously have a product line quietly losing money on every unit and another line carrying more than its share of the profit. Neither shows up until the number is broken apart.

The starting question is not 'are we profitable' but 'profitable at what, and for whom.' That reframing is the entire discipline behind profitability and margin analysis.

Separate direct cost from indirect cost first

Direct costs are the ones that would disappear if a specific product, service or customer disappeared: materials, subcontractors, direct labor hours, shipping, transaction fees, and any cost tied specifically to delivering that item. Indirect costs — rent, management salaries, insurance, software, marketing — continue regardless of any single product's existence.

The most common mistake at this stage is lumping too much into 'overhead' out of convenience. If a cost can be traced to a specific line of business with reasonable effort, it belongs there, not in a shared bucket that dilutes the signal.


Allocate labor and delivery time honestly

Labor is usually the largest cost most businesses under-allocate. Time tracking, even approximate, by project, client or product line turns payroll from an overhead line into a direct cost that can be attributed accurately. Service businesses in particular find that a handful of accounts consume disproportionate delivery hours relative to what they pay.

Where exact time tracking is not practical, a reasonable estimate — built from typical delivery patterns and validated with the team doing the work — is far better than defaulting labor entirely into overhead. An imperfect allocation that is directionally right beats a perfectly precise number that hides the real driver.

Overhead allocation methods and their traps

Once direct costs are assigned, remaining overhead still has to be spread across products or services to get to a full contribution or fully-loaded margin. Common approaches include allocating by revenue share, by direct labor hours, or by a defined activity driver (units produced, orders processed, square footage used).

The trap is choosing a method for its simplicity rather than its accuracy. Allocating overhead purely by revenue, for example, systematically flatters high-revenue, low-effort lines and penalizes lower-revenue lines that actually consume more operational support. The allocation basis should reflect what is actually driving the cost, even if it takes more effort to calculate.

Customer profitability and cost to serve

The same logic applies one level down, to individual customers or accounts. Two customers generating identical revenue can have very different profitability once you account for order frequency, custom requirements, support volume, payment terms and return or rework rates. 'Cost to serve' analysis assigns these servicing costs to the customer that generates them.

This is often where the most uncomfortable findings surface: a long-standing, high-revenue customer relationship that is, once cost to serve is included, barely breakeven or actively unprofitable.

Watch for the 80/20 pattern

Once contribution margin is calculated by line and by customer, a familiar pattern tends to appear: a minority of products, services or accounts generate the large majority of profit, while a long tail contributes little or actively subtracts from it. This is not a coincidence particular to one business — it shows up almost everywhere once the analysis is done properly.

Recognizing the pattern matters because it reframes growth strategy. Adding more revenue in the unprofitable tail does not fix the business; it just makes the averaging problem larger.

What to do with unprofitable work

Once a product, service or customer is confirmed unprofitable, there are generally three responses: reprice it to reflect true cost, restructure how it is delivered to reduce that cost, or exit it deliberately. Each is a legitimate strategy — the failure mode is doing none of the three and continuing to deliver the same work at the same price indefinitely because it generates revenue.

Repricing is usually the first lever tried, and the least disruptive, but it only works if the customer or market will bear the increase. Restructuring delivery — changing scope, reducing customization, automating a manual step — is slower but often more durable. Exit should be reserved for work that cannot be repriced or restructured into profitability and that is displacing capacity better spent elsewhere.

Connect the analysis to pricing and capacity decisions

A profitability breakdown is only useful if it changes decisions. That means feeding the results directly into pricing conversations, sales incentive design, and decisions about where to add headcount or capacity. If the highest-margin line of business is capacity-constrained while the sales team is incentivized to sell the lowest-margin one, the analysis has been done and then ignored.

Keep the analysis alive in monthly reporting

A one-time profitability study loses value quickly as mix, cost and pricing shift. The margin-by-line or margin-by-customer view belongs in the recurring management reporting package alongside the financial KPIs a business owner should already be watching, not as an annual special project.

This is one of the areas where financial reporting and KPI management work pays off directly: the systems and dashboards built to track margin monthly are what make the difference between a one-time insight and an ongoing management tool.

Where this fits with broader financial leadership

Profitability analysis is rarely an isolated exercise. It intersects with cash flow — a low-margin line can still consume disproportionate working capital — and with the broader forecasting and strategy work that a fractional CFO typically leads. If the business is already noticing signs that decisions have outgrown its current financial visibility, see do you need a fractional CFO for the broader diagnostic.

Businesses that feel like revenue is climbing while cash stays tight often find the two issues are related: unprofitable growth is consuming the cash that profitable growth would generate. That connection is explored in when revenue is growing but cash flow is tight.

FAQ

Questions About This Topic

Business owner reviewing performance figures on a tablet in an operating workspace

Cash Flow

Revenue Is Growing. So Why Is Cash Still Tight?

A growing top line and a tightening bank balance are not a contradiction — they are the normal, predictable behavior of a business whose working capital cycle is expanding faster than its cash reserves.

7 min read
Finance leader presenting a performance chart to a small leadership team in a meeting room

Fractional CFO

What Does a Fractional CFO Actually Do?

A fractional CFO builds the forward-looking financial picture a business does not have on its own: cash forecasts, margin analysis, KPI reporting and the decision support behind hiring, pricing and financing choices.

9 min read

See where your business stands financially.

The Financial Clarity Assessment takes two minutes and scores your visibility across cash flow, profitability, forecasting, reporting and decision support.